Three data sources that fuel robust retail demand forecasting
Learn about the three most important data sources for generating the best retail demand forecasts, and how solutions like Nextail help retailers make smart inventory decisions.
At a time when inflation, supply chain disruptions, and shopper spending is being squeezed by the current economic climate it’s more important than ever for fashion and collection-based retailers to be able to dynamically align their inventory with demand. Static, top-down forecasting based solely on historical data can only go so far. To stay agile and maximize sell-through retailers need to take a bottom-up approach to inventory management, especially when it comes to forecasting retail demand.
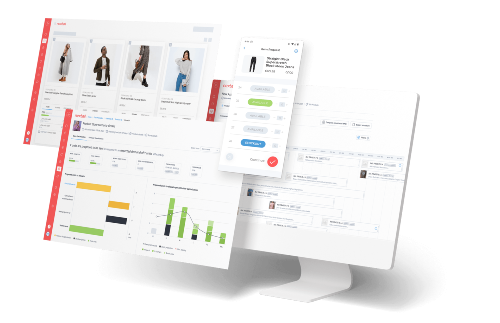
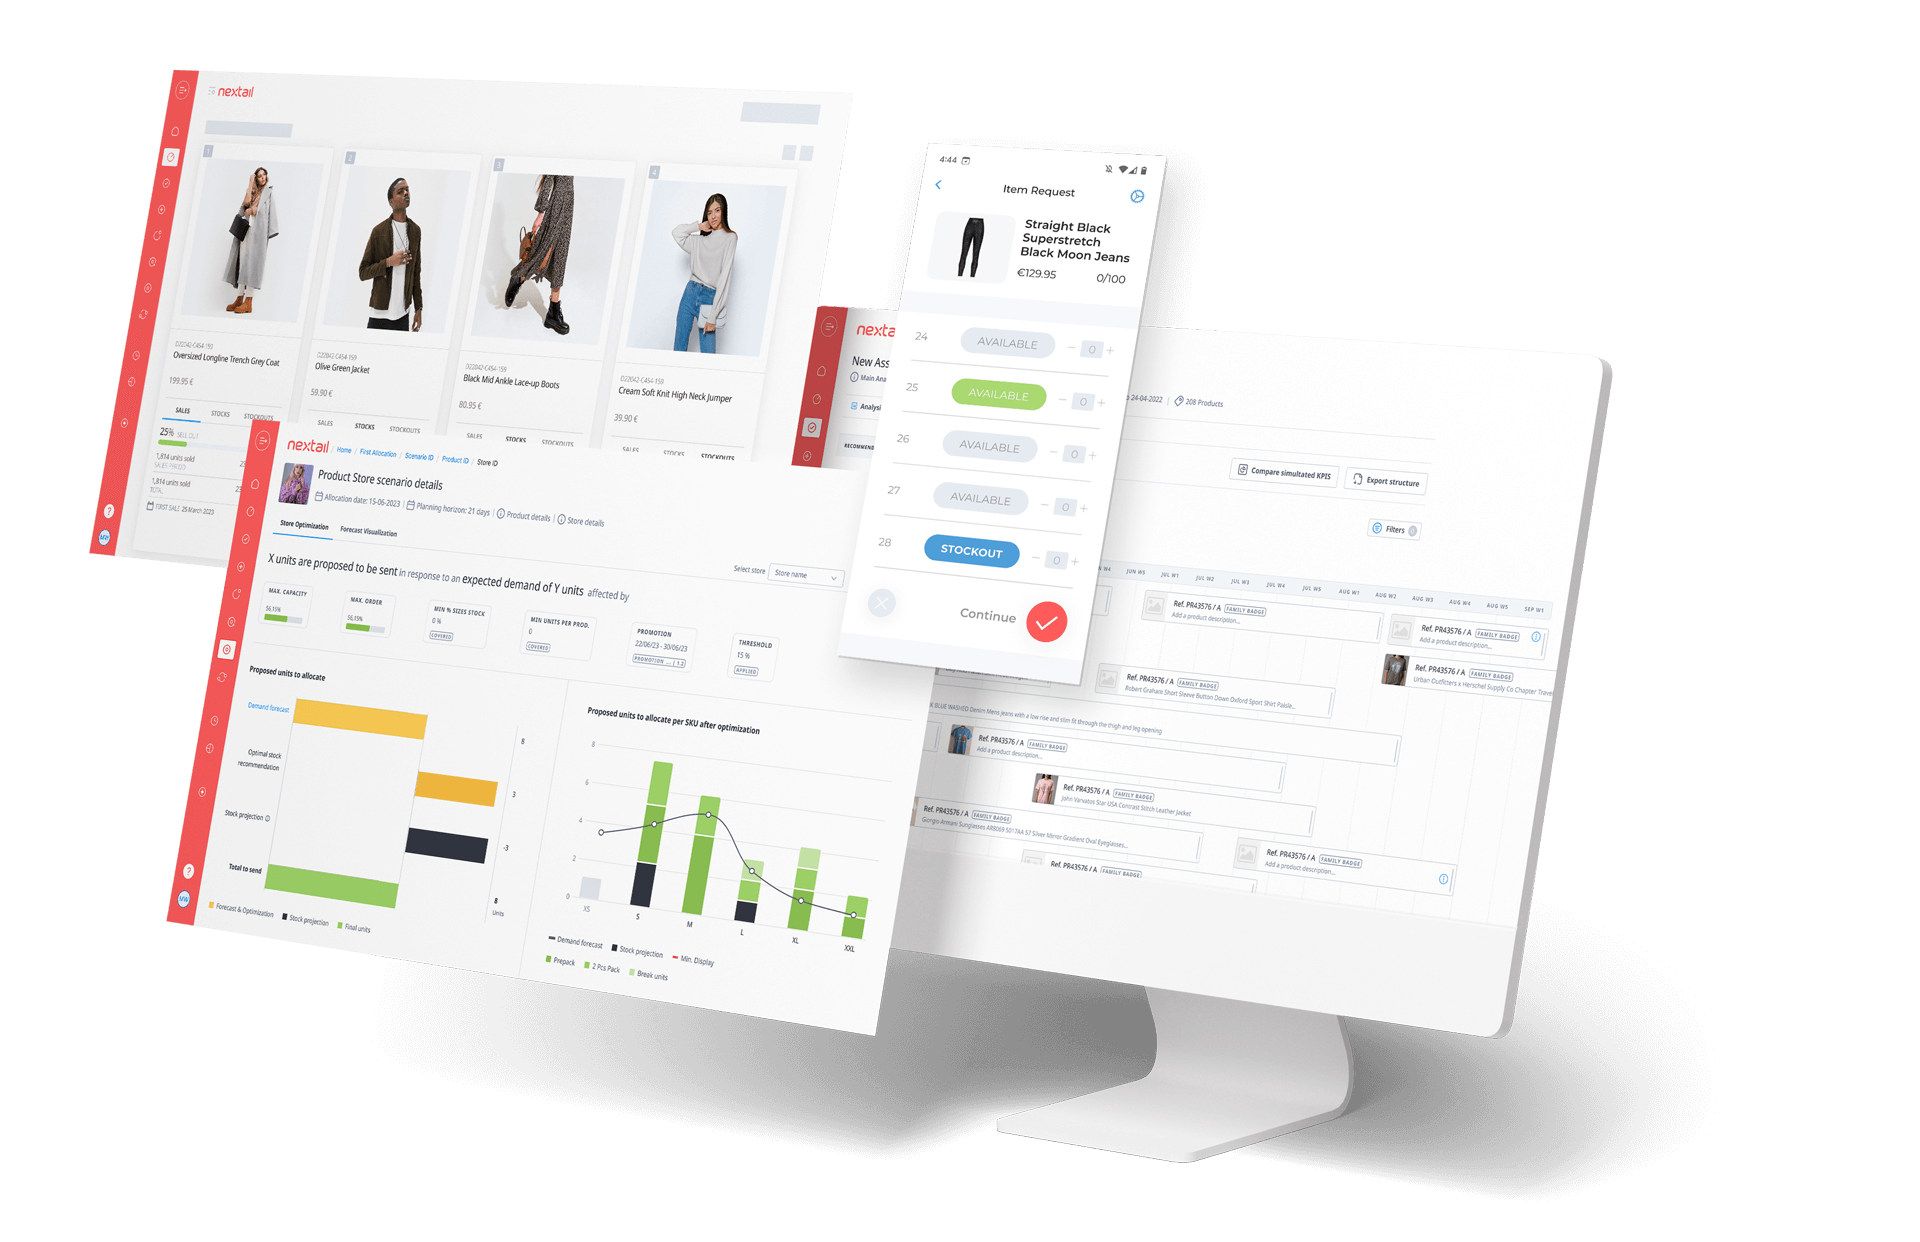
Solutions, such as Nextail, use machine learning and big data to carry out the most robust retail demand forecasting that helps teams understand the probability of demand for each item, in every size, and location, for a given planning horizon, or weeks of desired coverage. The optimization engine then maximizes sales even further by ensuring that stock is allocated to stores/channels with the highest probability of selling these products to make sure that each movement is “worth it” from a financial and efficiency standpoint.
Calculating retail demand forecasting for the long and short-term
Nextail primarily draws data from 3 different sources to calculate demand forecasts and subsequently optimize them: retailer data, external data, and system-generated data
1. Retailer data: Structured and unstructured
Firstly, Nextail “ingests”, or collects different types of internal data that a retailer has been consciously or unconsciously collecting, including data from ERPs and even random files on a retailer’s desktop.
When a retailer begins partnering with Nextail, a team of experts carries out a technical integration in order to review what retailer data is available, check its “integrity” (accuracy, completeness, reliability), standardize it, and make sure that this data can automatically and correctly be fed into Nextail for use.
From that point on, retailer data is used for:
- Master data: This information will be used across Nextail to best understand a retailer’s logistics, including information on stores, products, warehouses, categories, and more.
- Daily data: This more variable information informs Nextail of the daily state of the retailer’s stock, merchandising configurations, sales, shipments, etc.
This data is generally either “structured” and “unstructured”.
Structured retailer data
By “structured” data, we mean data that has already been collected, organized and stored in some way, like data coming from a company’s ERP. For example, this data includes sales and stock data at the most granular level (by SKU) on a daily basis.
Unstructured retailer data
Nextail also uses a retailer’s “unstructured” data, which is data that hasn’t yet been organized or is perhaps a mix of a variety of data types from across different systems of a retailer’s business. Data of this type includes things like uncategorized product images, visual merchandising requirements, store assortment plans or promotional calendars, among others.
2. System-generated data
Nextail also manages data pertaining to each retailer, even if the retailer hasn’t been recording it. This data is automatically generated based on the previously collected structured and unstructured retailer data.
This data informs decision-making and helps retailers measure the potential impact of carrying out Nextail-delivered decisions, and includes data points such as:
- Product attributes – When there is a lack of data for a product or when opening a new store, Nextail can identify comparable products being sold currently or in the past, through product master data or through visual recognition, a type of artificial intelligence, using product imagery.
Size curves and other store demographic data – Nextail can calculate demographic information per SKU and store such as size curves which are the weight each size of each product has in terms of sales in a given store.
- Top products and stores – Nextail can inform retailers of their best performing products and stores across their networks. They can view the performance and availability of each product in each store, as well as other information such as how each product compares to another or when and where the sale of each took place.
- Stockouts – The unavailability of stock across a retailer’s network helps retailers understand the impact of products that are missing but shouldn’t be and to ensure sufficient replenishments in the future. Nextail measures two types of stockouts.
- Real – When a SKU isn’t available in store but IS available in the warehouse.
- Absolute – When a SKU isn’t available in the store regardless of whether or not it is available in the warehouse.
- Lost sales – Nextail calculates “lost sales” to measure the impact of stockouts on a retailer’s bottom line by combining the stockout metric with an internal forecast. It is able to pinpoint cases in which better assortment and distribution would be worth the investment of stock adjustments.
- Zero sales – Nextail also lists stores in which best-selling products have had zero or minimal sales in the last seven days which can help clue retailers into possible causes such as display issues, missing stock, etc.
- Ghost stock – When Nextail detects formerly strong-selling, in-stock items that have stopped selling over the last seven days, this is considered “ghost stock”, alerting retailers to possible tracking discrepancies, theft, or lost sales.
3. External data
The final type of data that Nextail demand algorithms consider is external data. This data does not come from a specific retailer itself, but it is data that represents elements from outside of the organization or from the industry at large that might affect the elasticity of demand.
One of the most important external data factors that Nextail considers is that of seasonality, or the points in the year with observable demand shifts that tend to be repeatable. For example, certain periods of the year may have regularly increased demand (e.g. Black Friday, winter holiday season, back to school season) or decreased demand (e.g. the periods immediately preceding or following major sales events). Nextail calculates seasonality at both store and product-group level, meaning that different categories of products have different seasonalities.
Since seasonality directly affects demand forecasts, Nextail uses this information to inform a more accurate short-term forecast. In combination with retail and other data sources, Nextail is able to forecast future demand per SKU, store, and day.
Better data leads to better demand forecasts & immediate benefits
Nextail collects and processes all of the data above in order to generate the most robust, granular, and hyper-local demand forecasts possible. With them, retailers understand the likelihood of every single product selling at every single location over a set period of time.
Not only does this mean that they are more likely to sell 5-10% more items at full price throughout the season, they’re also less prone to stockouts and lost sales opportunities, all while reducing coverage. In the meantime, they can hold on to more warehouse stock for longer as it becomes necessary in different channels as time goes by.
Most importantly, Nextail demand forecasts are based on the freshest data available at all times, so retailers are always ready to adapt their strategies both during times of mass uncertainty and times of relatively standard operating conditions (if such a thing still exists!).