DISCOVER NEXTAIL: The Merchandise
Planning Platform
for Fashion
Planning Platform
for Fashion
0%
less coverage
0%
fewer shipments
0%
sales increase
Empowering retailers to sell more with less inventory
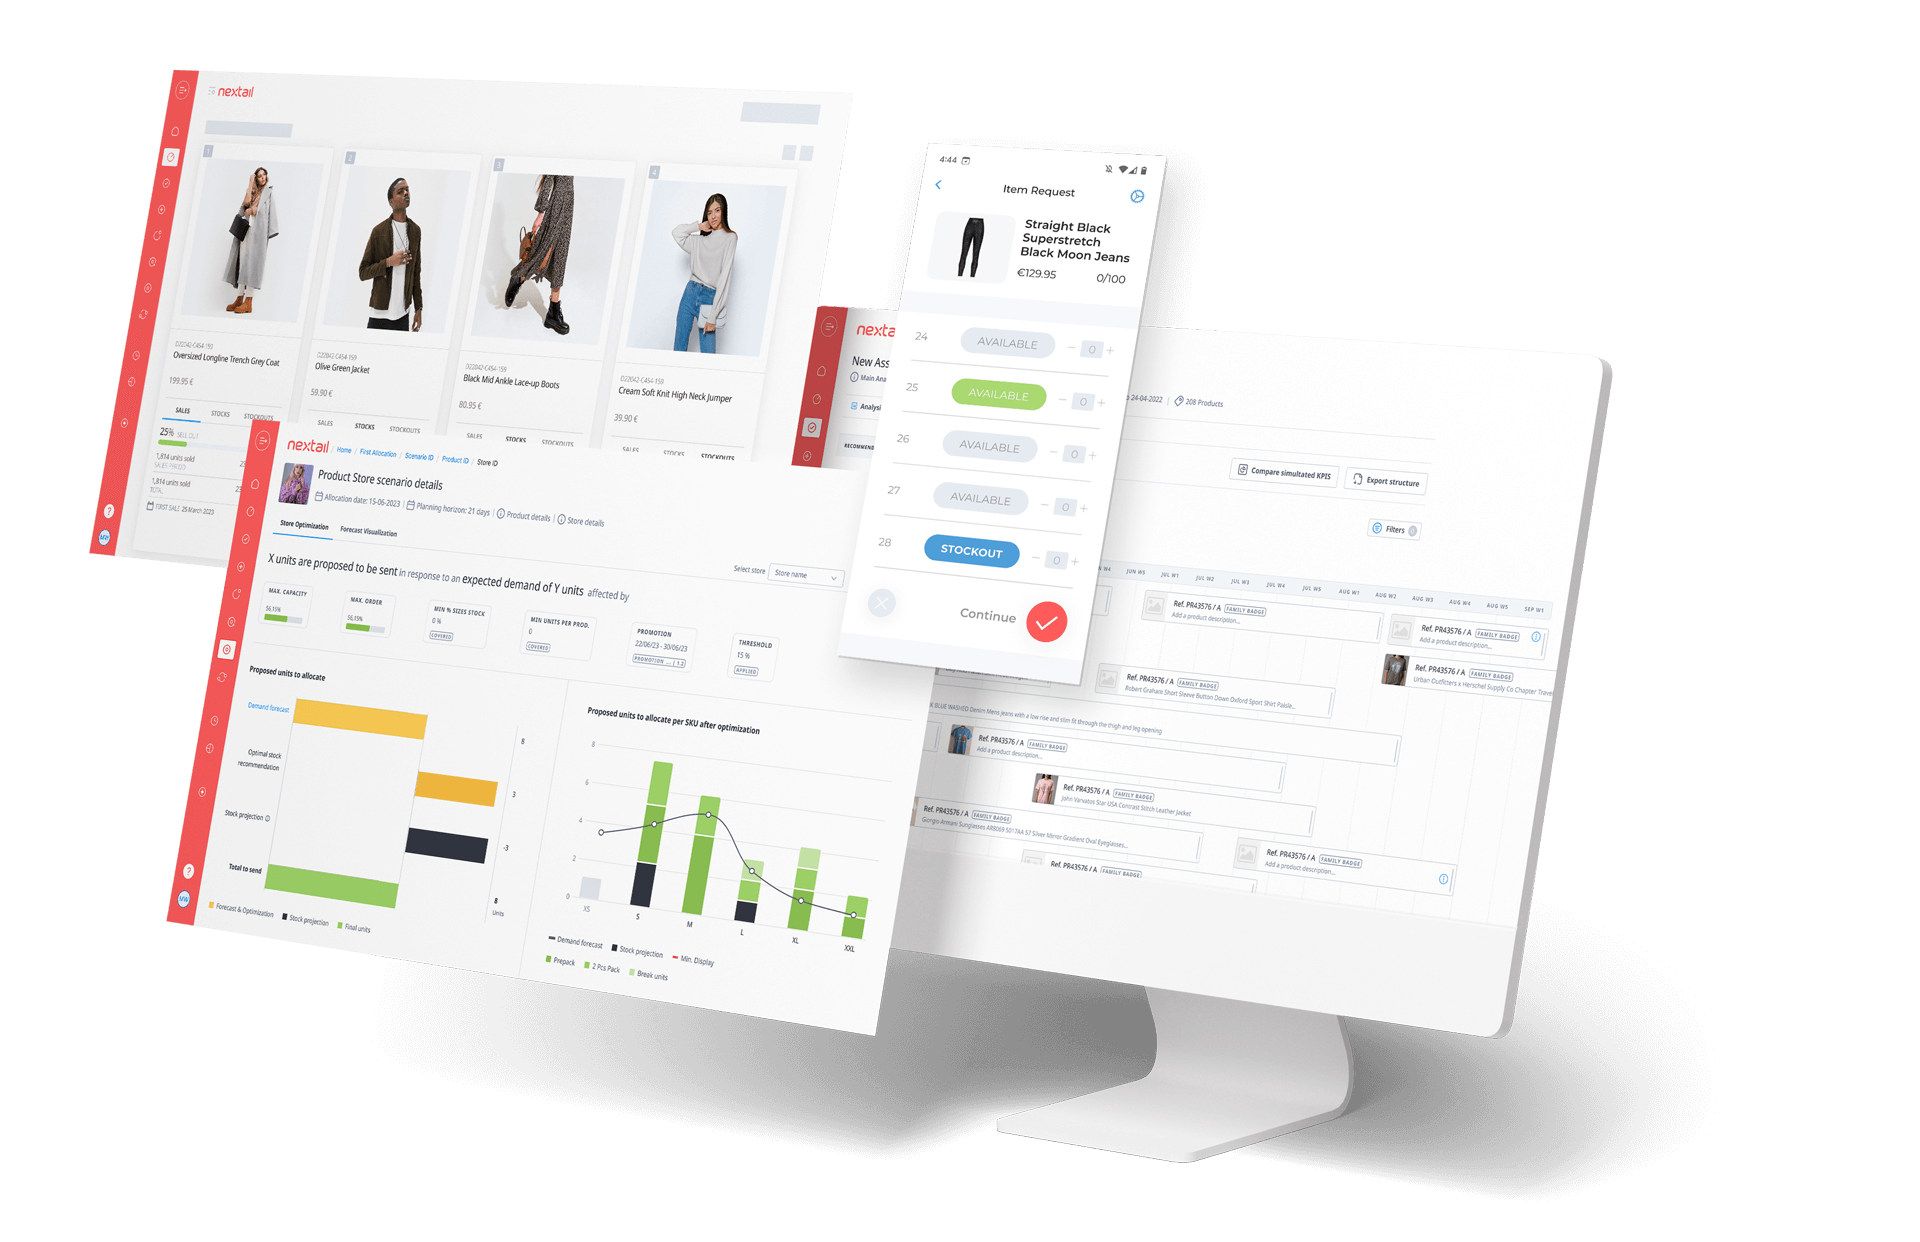
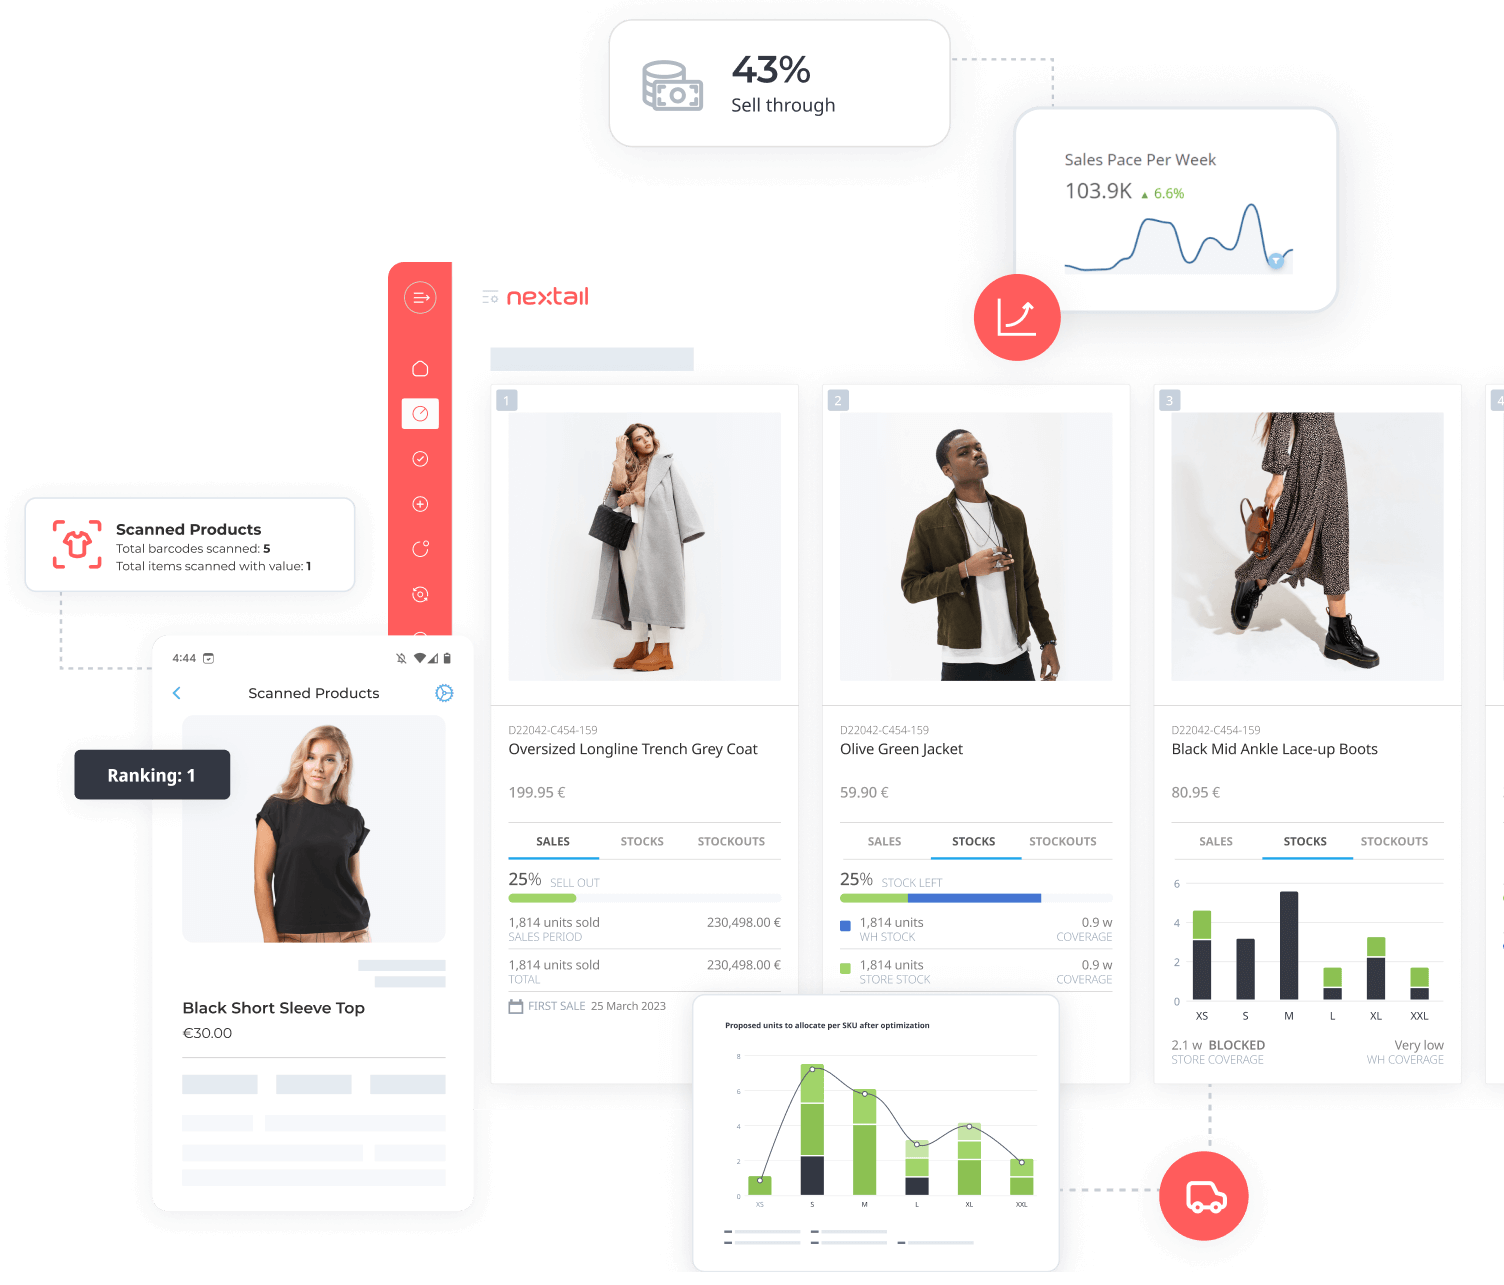
Nextail solutions enable fashion brands and retailers to continuously align planning and execution decisions with market demand by incorporating AI-powered technology into their core merchandising operations.


Trusted by leading fashion brands and retailers
Nextail was built by industry experts to meet the merchandising and planning needs of brands and retailers across a range of sectors from on-trend fashion to luxury goods and more.
Loading...


Powered by Nextail
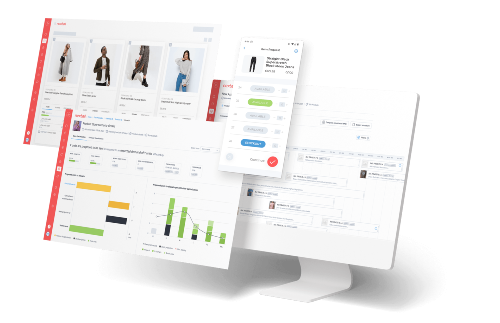
Intelligent solutions need strong foundations. The entire ecosystem is built on the Nextail merchandise planning platform, leveraging the latest in AI and machine learning to serve you with one unified view of your merchandising performance and capabilities.
And the more solutions you plug in, the more powerful it gets.
Keeping you ahead of the curve
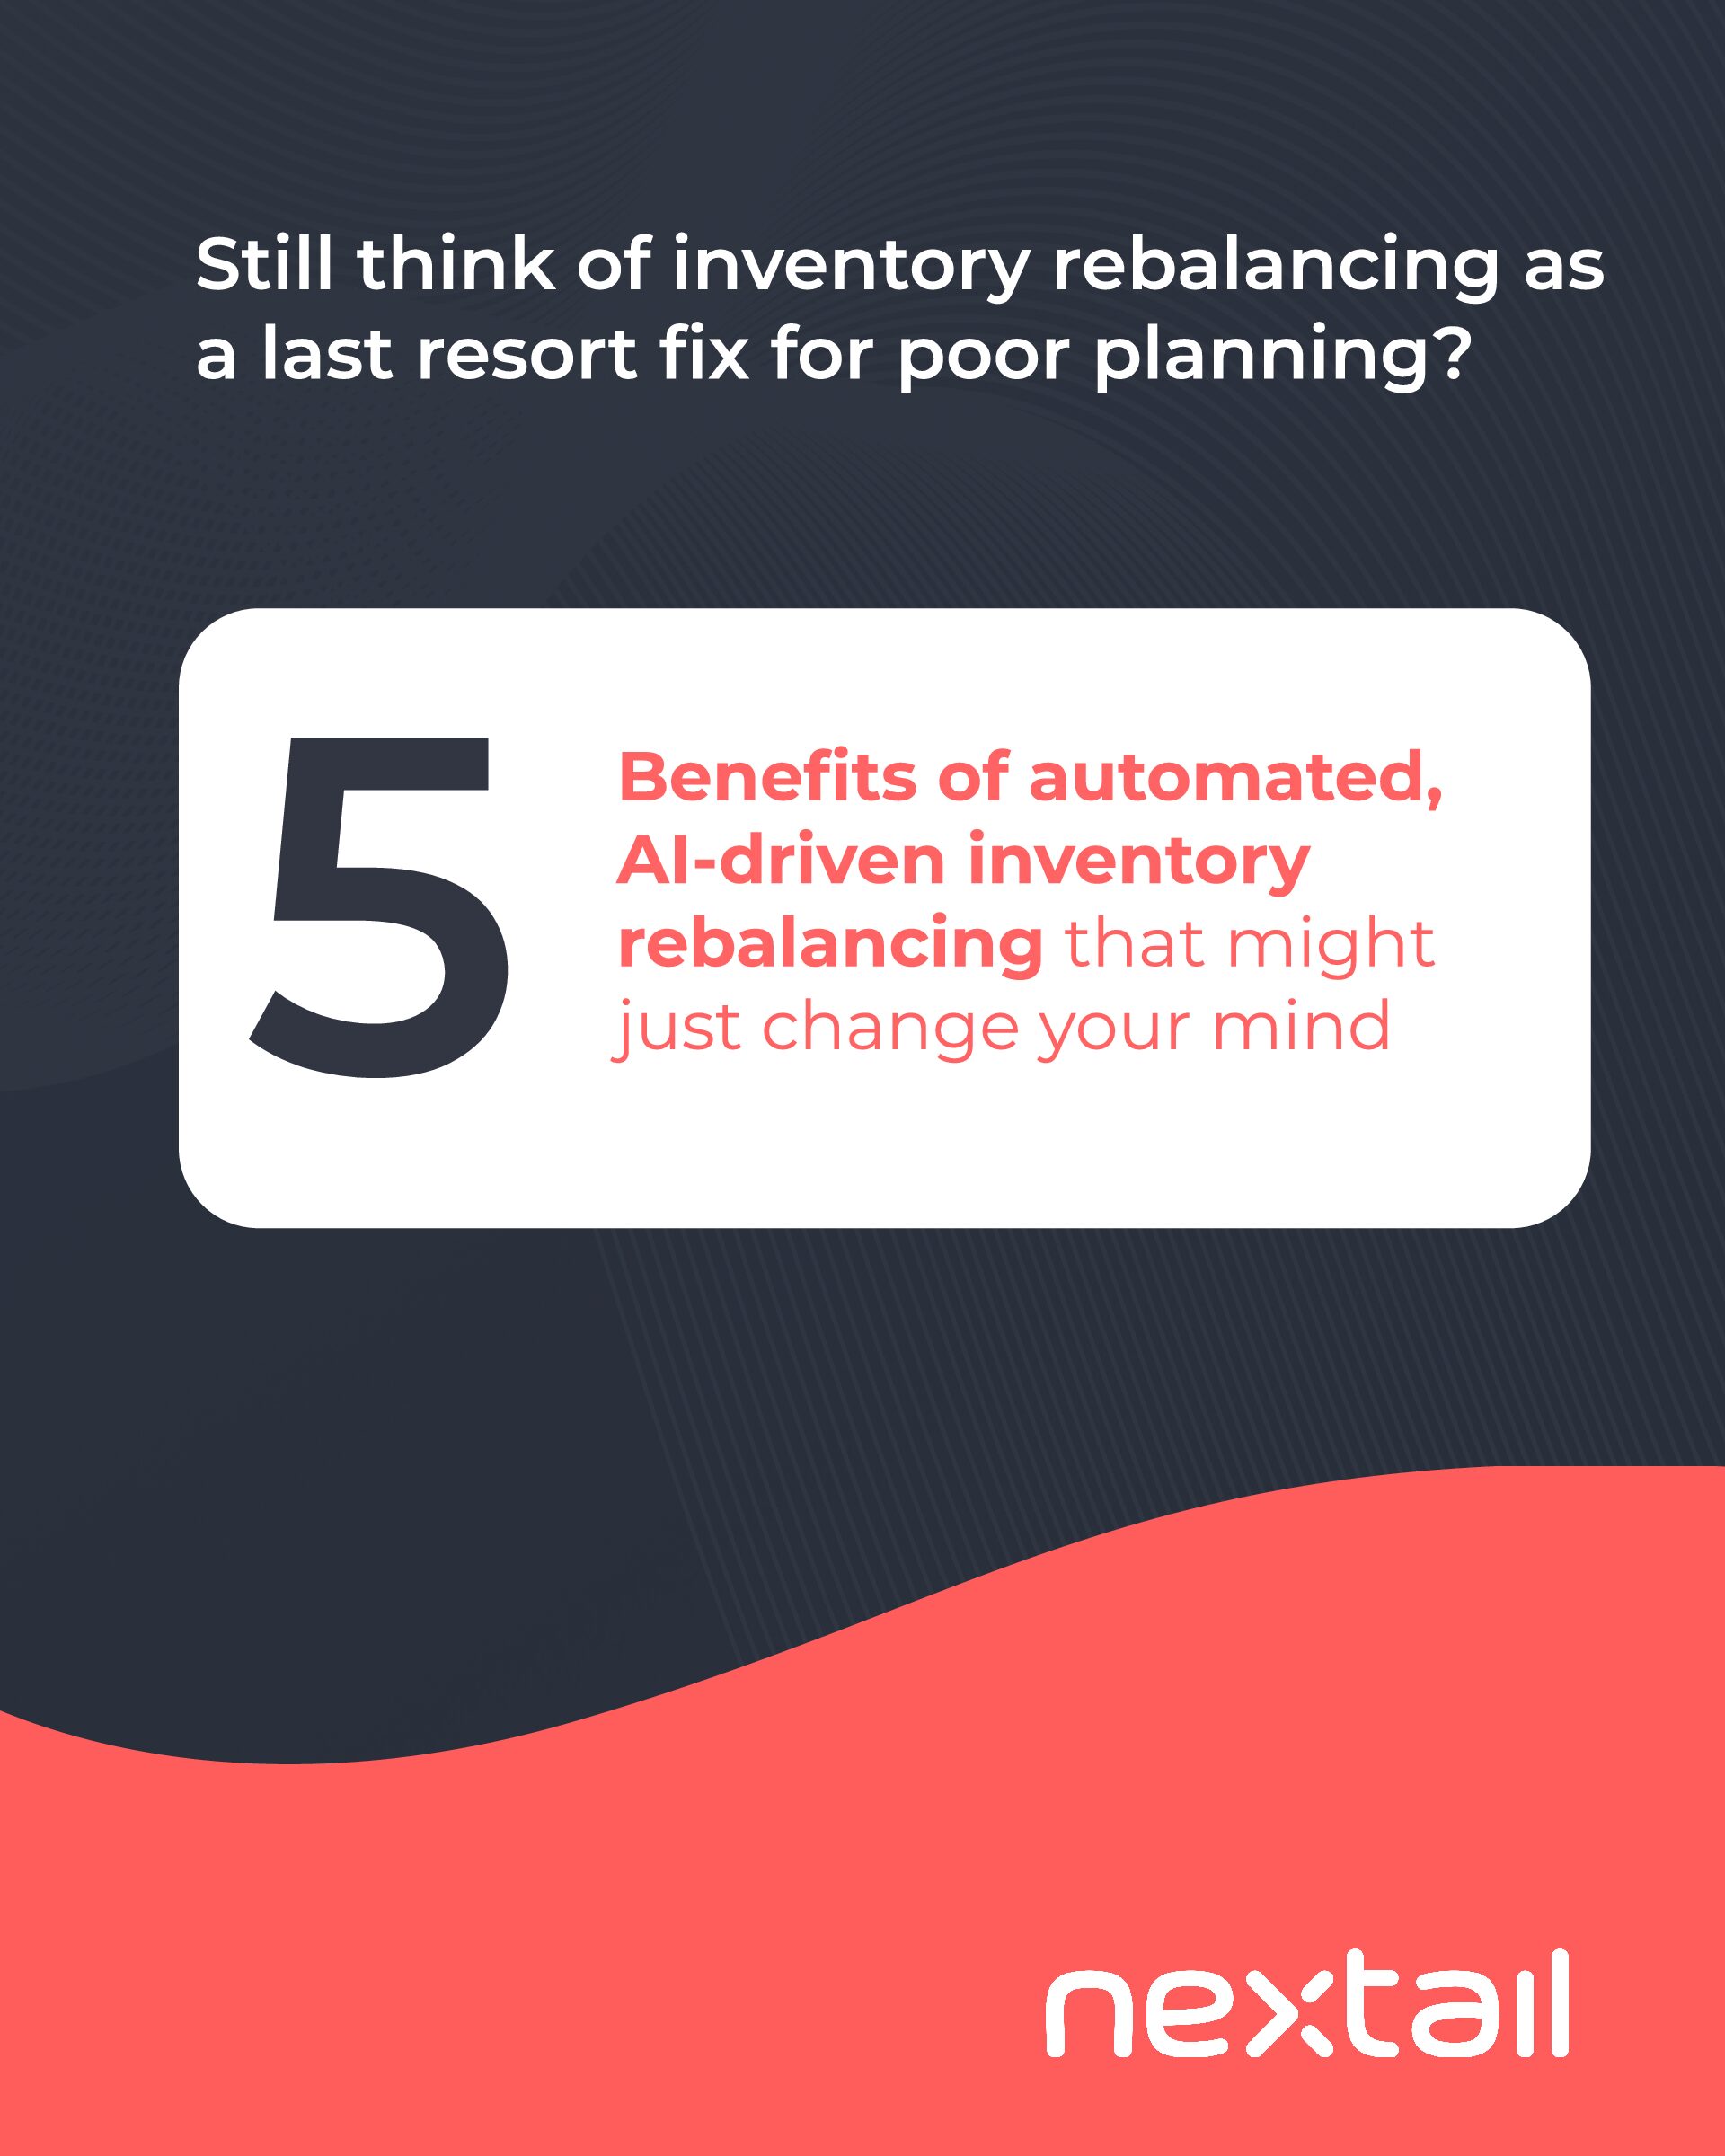
5 benefits of AI-driven inventory rebalancing

Understanding the basics: A guide to “bottom-up” hyper-local merchandise...
Jules partners with Nextail to transform core in-season merchandising...
Ready to see
real results?
Let us show you how Nextail can help drive profitable growth across your entire network of stores and channels.
Get started today
Let our experts show you how Nextail can help your organization to sell more with less stock.